モンテカルロ法---πの近似計算の速度比較
computing pi using Monte Carlo in R.
モンテカルロ法によるπの近似計算はよく取り上げられるテーマであるがプログラムでfor
loopと使ったものと行列演算で処理する方法では、どの程度に実行速度に差が出るのかを調べてみた。

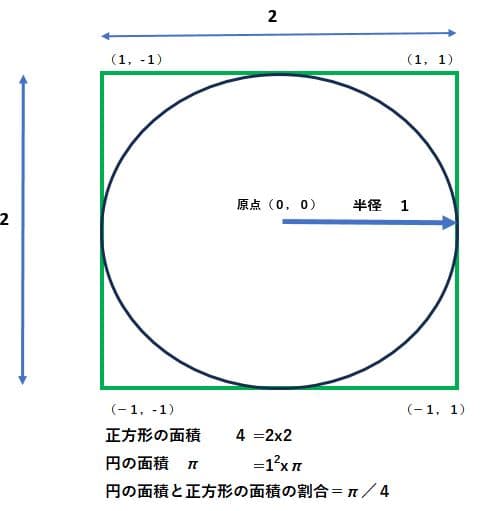
上図のように半径1の円が縦横2の正方形の中に収まっていれば正方形の面積は2X2=4で円の面積は1X1Xπ となる。この上にケーキ屋さんが粉砂糖を万遍なく振りかけるイメージで、円内にある粉の数と正方形全体の粉の個数を調べる。円内にある粉の個数と正方形内にある粉の個数の割合は円の面積/正方形の面積=π/4となるはずである。そこでモンテカルロシミュレーションで円内にある粉の個数の割合がyだったとすればπ/4=yからπ=yX4で近似計算できる。
モンテカルロ シミュレーションでは粉の代わりに一様乱数(区間-1から+1まで)を使って反復計算する。
最初にfor loopを使って乱数を生成する方法でシミュレーション(試行回数1000)を行ってみる。(試行回数が少ない方が描画が塗りつぶされないので比較がしやすい。)
# πの近似計算 for loop で繰り返し計算
start1<-proc.time() # 計算開始
iterat <- 1000 # 反復回数
count <- 0 # 円の中に入るサンプル数
x<-0
y<-0
xx<-0
yy<-0
set.seed(123)
# x,yについて一様乱数(-1から+1の区間)を生成
for(i in 1:iterat) {
x[i] <- runif(1, min=-1, max=1)
y[i] <- runif(1, min=-1, max=1)
# 円内に入るサンプル個数を計測
if(x[i]^2 + y[i]^2 <= 1) {
count <- count + 1
xx[count]<-x[i]
yy[count]<-y[i]
}
}
# πの近似値を計算(正方形の面積が4=((1-(-1))^2
# 円の面積は半径1の2乗×π=π
# π÷4=円の面積÷正方形の面積
# π=4×円の面積÷正方形の面積
# 円の面積、正方形の面積は各サンプル数で近似
piest <- 4 * count / iterat
print(piest) # πの近似値## [1] 3.16
proc.time()-start1 # πの近似計算の所要時間## ユーザ システム 経過
## 0.00 0.00 0.05
シミュレーションの反復計算で0.05秒要している。
start2<-proc.time()
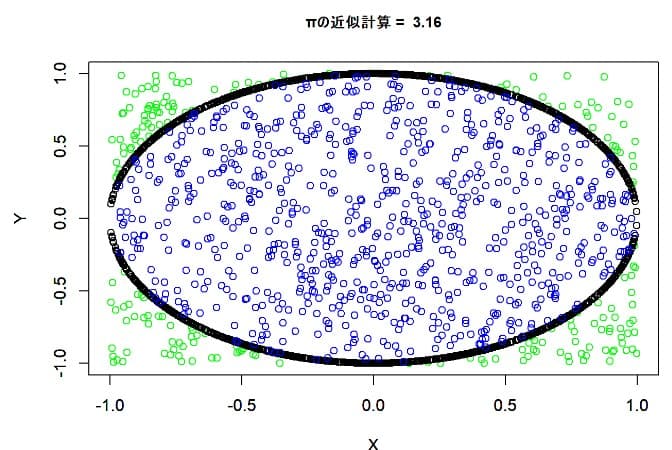
plot(x,y, type = "p", xlab = "X", ylab = "Y",
xlim = c(-1,1), ylim = c(-1, 1), col = "green")
par(new=T)
plot(xx, sqrt(1-xx^2),type = "p", xlab = "X", ylab = "Y",
xlim = c(-1,1), ylim = c(-1, 1))
par(new=T)
plot(xx, -sqrt(1-xx^2),type = "p", xlab = "X", ylab = "Y",
xlim = c(-1,1), ylim = c(-1, 1))
title(main=paste("πの近似計算 = ", piest),cex.main=0.9)
points(xx,yy, col = "brown")

proc.time()-start2 # グラフ作成の所要時間## ユーザ システム 経過
## 0.03 0.05 0.08
簡単な作図であるが0.08秒要している。
次に生成した乱数をマトリックスに入れて計算してみる。
start3<-proc.time()
## 上記と同様の計算を行列を使って
# 一様乱数を生成しπの近似値を計算
set.seed(123)
mdata2 <- matrix(runif(n =2*iterat,min = -1, max = 1),
nrow = iterat, ncol = 2,byrow=T)
x1<-mdata2[,1]
y1<-mdata2[,2]
inc <- (mdata2[, 1] )^2 + (mdata2[, 2] )^2 < 1
# 円内のサンプル数合計.
M <- sum(inc)
piest2<-(M/iterat) * 4
piest2## [1] 3.16
proc.time()-start3 # πの近似計算の所要時間## ユーザ システム 経過
## 0 0 0
πの近似計算時間は0.01秒未満となっている。行列を使うと実行速度は速いようだ。
start4<-proc.time()
plot(x1,y1, type = "p", xlab = "X", ylab = "Y",
xlim = c(-1,1), ylim = c(-1, 1), col = "green")
par(new=T)
plot(mdata2[,1], sqrt(1-mdata2[,1]^2),type = "p", xlab = "X", ylab = "Y",
xlim = c(-1,1), ylim = c(-1, 1))
par(new=T)
plot(mdata2[,1], -sqrt(1-mdata2[,1]^2),type = "p", xlab = "X", ylab = "Y",
xlim = c(-1,1), ylim = c(-1, 1))
title(main=paste("πの近似計算 = ", piest2),cex.main=0.9)
points(mdata2[inc,1],mdata2[inc,2], col = "blue")
proc.time()-start4 # グラフ作成の所要時間 ## ユーザ システム 経過
## 0.00 0.04 0.06
作図の時間はfor loopのと場合と変化はない。
set.seedで乱数を再現可能に設定してあるが、念のために生成されたデータ同一性をチェックしてみる。
# 生成されたデータの同一性を検証
head(mdata2,5)## [,1] [,2]
## [1,] -0.42484496 0.57661027
## [2,] -0.18204616 0.76603481
## [3,] 0.88093457 -0.90888700
## [4,] 0.05621098 0.78483809
## [5,] 0.10287003 -0.08677053
head(x,5)## [1] -0.42484496 -0.18204616 0.88093457 0.05621098 0.10287003
head(y,5)## [1] 0.57661027 0.76603481 -0.90888700 0.78483809 -0.08677053
head(xx,5)## [1] -0.42484496 -0.18204616 0.05621098 0.10287003 0.91366669
head(mdata2[inc,1],5)## [1] -0.42484496 -0.18204616 0.05621098 0.10287003 0.91366669
head(yy,5)## [1] 0.57661027 0.76603481 0.78483809 -0.08677053 -0.09333169
head(mdata2[inc,2],5)## [1] 0.57661027 0.76603481 0.78483809 -0.08677053 -0.09333169
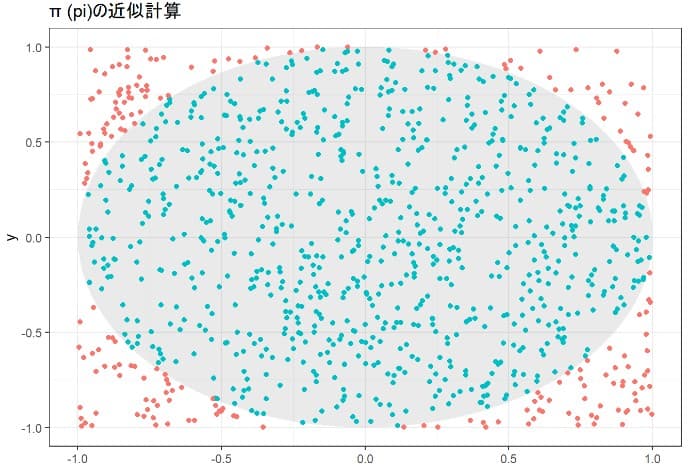
もう少しグラフの見栄えをよくするためにグラフ専用のパッケージggplot2を使って描画してみる。
##グラフ描画専門のパッケージを使ってみる
library(ggplot2)
x_val=c(0,seq(-1,1,length.out=1000))
y_val=c(0,sqrt(1-seq(-1,1,length.out=1000)^2))
x_val2=c(0,seq(-1,1,length.out=1000))
y_val2=-c(0,sqrt(1-seq(-1,1,length.out=1000)^2))
ggpi <- ggplot() +
geom_polygon(aes(x=x_val,y=y_val),alpha=0.1) +
geom_polygon(aes(x=x_val2,y=y_val2),alpha=0.1) +
theme_bw()
ggpi + geom_point(aes(x=x1,y=y1,color=inc)) +
xlab("x")+ylab("y")+labs(title="π (pi)の近似計算") +
theme(legend.position="none")

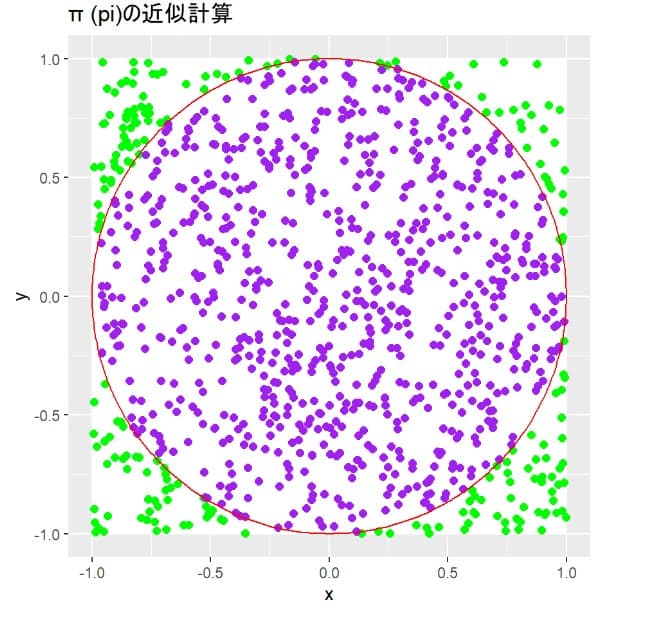
もう少し円グラフを真円に見えるようにするためにグラフ専用のパッケージggforceを追加して描画してみる。
##グラフ描画専門のパッケージを追加して真円に近い作図をしてみる
library(ggforce)
ggplot() +
geom_rect(aes(xmin = -1, ymin = -1, xmax = 1, ymax = 1),
fill = "white", color = "white") +
geom_point(aes(x = x1, y =y1 ,color="black")
,size = 2,color="green") +
geom_point(aes(x = mdata2[inc,1], y =mdata2[inc,2] ),size = 2,color="purple") +
geom_circle(aes(x0 = 0, y0 = 0, r = 1),color="red") +
coord_fixed(ratio = 1) +
xlab("x")+ylab("y")+labs(title="π (pi)の近似計算") +
theme(legend.position="none")

試行回数を10万回に設定して上記の作業をするとfor
loopによるシミュレーションではπの近似計算に0.42秒、マトリックスを使ったπの近似計算で0.01秒未満であったが、ggplot2を使った作図で9.22秒、ggforceを追加した場合が9.28秒を要した。
結局のとこπの推定時間よりもグラフ描画に要する時間のほうが圧倒的におおきくなる。重要な外部者に対するプリゼンとか論文の発表でなければ簡素なグラフのほうが生産性や効率性の点でよいかもしれない。